Bitcoin has fallen back below $75,000 as selling pressure and market uncertainty combine to test the resilience of a recovery that has struggled to establish the structural foundation needed for a sustained advance. The breakdown is concerning on its own terms — but a CryptoQuant analyst has identified a data point in the exchange reserve data that places the current moment in a historical context that spans nearly six years of Bitcoin market cycles.
Bitcoin’s Exchange Reserve across all exchanges has fallen to 2,666,753 BTC. The last time that specific reserve level was recorded was August 31, 2019 — when Bitcoin was trading at approximately $9,430. Today, Bitcoin trades near $77,300. The same exchange inventory reading. Approximately eight times the price.

Bitcoin Bull-Bear Market Cycle Indicator | Source: CryptoQuant
That comparison creates an immediate and important question. Two identical exchange reserve readings at dramatically different price levels describe two fundamentally different market structures — different participant compositions, different institutional presence, different regulatory environments, and different on-chain dynamics surrounding the same supply number. The reserve figure is the same. Almost nothing else about the two moments is.
The CryptoQuant analyst uses a second indicator alongside the reserve data to capture what the raw number cannot — the Bull-Bear Market Cycle Indicator, which characterizes the structural regime surrounding each reserve reading and determines whether the same supply level carries the same forward implication in 2026 as it did in 2019.
Same Supply Level But Two Very Different Market Regimes
The CryptoQuant analysis places the identical exchange reserve readings side by side and reveals the structural divergence that makes the comparison as alarming as it is instructive. In August 2019, the Bull-Bear Market Cycle Indicator stood at +0.83, with the 30-day moving average at +1.045 — readings firmly in bull territory that confirmed the demand context surrounding the supply constraint. Bitcoin leaving exchanges in 2019 was occurring against a backdrop where the cycle structure supported the thesis that reduced available supply would meet genuine buying interest.

Bitcoin Exchange Reserve | Source: CryptoQuant
In May 2026, the same indicator reads -0.379, with the 30-day moving average at -0.375 and the 365-day moving average at -0.323. The current exchange reserve level is identical to 2019. The cycle regime surrounding it is the opposite.
The analytical framework the report establishes is precise. Declining exchange reserves reduce the inventory available for immediate sale — that supply dynamic is constructive regardless of the cycle context. But supply constraints alone do not drive prices higher. Demand must arrive to meet the reduced available supply before the constraint translates into price appreciation. In 2019, the bullish cycle structure provided that demand confirmation. In 2026, it has not yet appeared.
The structural variable that separates 2026 from every previous exchange reserve comparison is the spot Bitcoin ETF. Approved in January 2024 and representing a category of demand that did not exist in August 2019, ETF inflows have been a persistent feature of the declining reserve environment throughout the entire post-approval period. That structural buyer changes the demand equation in ways the 2019 comparison cannot fully capture.
Whether ETF demand is sufficient to bridge the gap between the current supply constraint and the demand confirmation that the Bull-Bear Indicator has not yet delivered is precisely what the current market setup is testing — and what the next phase of Bitcoin’s price action will begin to answer.
Bitcoin Bears Retake Short-Term Control
Bitcoin has fallen below the critical $75,000 region, confirming a significant loss of momentum after weeks of struggling beneath major resistance near the $80,000–$82,000 zone. The daily chart now reflects a market transitioning from consolidation back into defensive positioning, with sellers regaining short-term control after repeated failed breakout attempts throughout May.
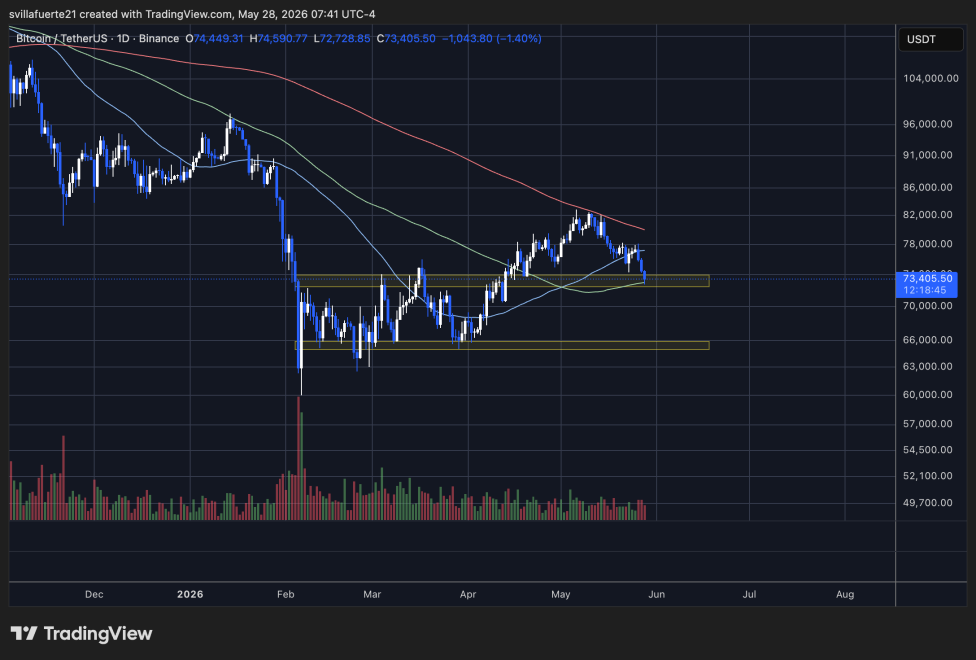
BTC consolidates below $75K level | Source: BTCUSDT chart on TradingView
Technically, the breakdown below the $73,500–$74,000 support cluster is an important deterioration in structure. That zone had acted as the foundation for the April recovery and aligned closely with the rising 100-day moving average, making it one of the most important support areas on the chart. Bitcoin is now trading below that level, while the 50-day moving average has started curling downward again after briefly stabilizing during the recovery phase.
The rejection from the declining 200-day moving average near $80,000 also reinforced the broader macro weakness still dominating the market. Bulls were unable to reclaim long-term trend resistance, and the failure triggered another wave of downside pressure that accelerated once short-term support gave way.
The next major demand zone now sits near the $65,000–$66,000 region, where buyers aggressively defended the price during the February capitulation event. Volume has started increasing slightly during the latest decline, suggesting market participation is rising again as uncertainty expands.
Unless Bitcoin can quickly reclaim the lost $74,000 region, the broader structure now favors continued downside pressure and prolonged volatility rather than immediate recovery continuation.
Featured image from ChatGPT, chart from TradingView.com
Editorial Process for bitcoinist is centered on delivering thoroughly researched, accurate, and unbiased content. We uphold strict sourcing standards, and each page undergoes diligent review by our team of top technology experts and seasoned editors. This process ensures the integrity, relevance, and value of our content for our readers.